Traders blow up not because they "called the direction wrong", but because they "were too heavy when they were wrong". You can be wrong on direction many times; be wrong on position sizing a few times and you're out. This article is the math that keeps you alive.
Disclaimer: all content on this site is for learning and research only and does not constitute investment advice. Markets carry risk; invest with caution.
1. Why Position Sizing Matters More Than Direction
⚠️ One Overweighted Trade Can End You
Suppose you have 100,000 yuan and go all in every time:
- Gain 50%, then lose 50% → 75,000 left (−25%)
- Gain 50% again, lose 50% again → 56,250 left (−44%)
- Four rounds in a row → 32,000 left (−68%)
You were "right half the time", yet the account is down nearly 70%. That is the mathematical penalty of oversized positions.
1.1 The Asymmetry Between Drawdown and Recovery
| Loss | Gain needed to break even |
|---|---|
| 10% | 11% |
| 20% | 25% |
| 30% | 43% |
| 50% | 100% |
| 70% | 233% |
| 90% | 900% |
The deeper the loss, the harder recovery gets — exponentially. Prime directive of position sizing: never put yourself in a position where you need a double just to get back to even.
2. Per-Trade Risk Exposure
2.1 The Core Formula
Max loss per trade = total account equity × risk percentage
Position size = max loss per trade ÷ stop-loss distance percentage
2.2 Worked Example
Account equity: 100,000 yuan
Risk percentage: 1% (max 1,000 yuan loss per trade)
Entry price: 100,000 (BTC)
Stop-loss price: 95,000 (5% stop distance)

Position size = 1,000 ÷ 5% = 20,000 yuan (BTC position)

Even if the stop-loss triggers, you lose only 1,000 yuan = 1% of total equity
2.3 Consequences of Different Risk Percentages
| Risk per trade | After 5 straight losses | After 10 straight losses |
|---|---|---|
| 0.5% | −2.5% | −4.9% |
| 1% | −4.9% | −9.6% |
| 2% | −9.6% | −18.3% |
| 5% | −22.6% | −40.1% |
| 10% | −41.0% | −65.1% |
💡 Industry Consensus
Professional traders and funds usually cap per-trade risk at 0.5%–2%. Above 5% is already aggressive; above 10% is gambling with your life.
3. The Kelly Formula
3.1 Formula
f* = (bp - q) / b

f* = optimal fraction of capital
b  = payoff ratio (average win ÷ average loss)
p  = win rate
q  = 1 - p (loss rate)
3.2 Example
Win rate p = 55%, payoff ratio b = 1.5

f* = (1.5 × 0.55 - 0.45) / 1.5
   = (0.825 - 0.45) / 1.5
   = 0.375 / 1.5
   = 0.25 → 25%
⚠️ The Kelly Trap
Kelly assumes you know your win rate and payoff ratio exactly — in reality both are estimates, and under parameter error full Kelly's drawdown can be catastrophic. In practice, traders use half Kelly or even quarter Kelly. For the full discussion of "why almost nobody runs full Kelly" (drawdowns, black swans, and a live-comparison table), see the risk-management section of Chapter 07 · Trading Systems.
4. Position Allocation Strategies
4.1 Fixed-Fraction Method
Use a fixed percentage of the account on every trade (say 10% or 20%). Simple and highly disciplined.
4.2 Volatility-Adjusted Method
Smaller positions for high-volatility instruments, larger positions for low-volatility ones. The goal: equal expected dollar volatility per trade.
BTC averages 3% daily moves, ETH 5%
If the BTC position is 30,000 yuan → ETH position = 30,000 × 3/5 = 18,000 yuan
Both trades then carry the same average daily dollar swing (~900 yuan)
4.3 Pyramiding
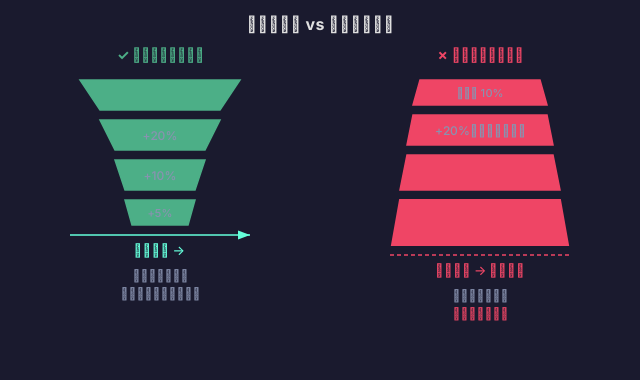
Initial position: 30% of capital (the largest, at the base)
First add: +20% (after the uptrend is confirmed)
Second add: +10% (trend continues)
Third add: +5% (only in extremely strong trends)

Average cost always stays below the current price; each add gets smaller
⚠️ Never Build an Inverted Pyramid
Adding to a loser (buying more as it falls) is an inverted pyramid — the biggest position sits at the bottom, and it gets heavier the more you lose. It is one of the most common retail self-destruction patterns. If you catch yourself "adding to a losing position", stop and ask: if I were flat right now, would I still buy at this price?
5. The Equity Curve and Maximum Drawdown
5.1 Maximum Drawdown
Max drawdown = (peak equity - trough equity) / peak equity

Example: the account rises from 120,000 to 150,000, then falls to 105,000
Max drawdown = (150,000 - 105,000) / 150,000 = 30%
5.2 Drawdown Control Rules
| Drawdown threshold | Action |
|---|---|
| 5% | Halve position size, review the strategy |
| 10% | Cut position size to 25%, stop adding |
| 15% | Cut position size to 10%, observe only, no trading |
| 20% | Stop trading entirely, do a full strategy review |
⚠️ Don't "Take a Shot" in a Deep Drawdown
After a 20% drawdown, the instinct is to "size up and win it back fast" — which almost always guarantees a deeper drawdown. The right sequence: shrink position → cut risk → find the problem → start again.
6. Pre-Trade Checklist
Run through this before every order:
- What is my maximum loss on this trade? (amount + percentage)
- Where is my stop-loss? Is the stop distance reasonable?
- What share of the account does this position take? Does it fit my risk rules?
- If I lose 3 trades in a row, what is my total drawdown?
- Am I executing a plan, or chasing rallies and dumping on dips?
⚠️ Risk Warning
Everything in this article is for learning and research only and does not constitute investment advice. Crypto trading carries high risk; leveraged trading can result in the loss of your entire principal. Decide carefully based on your own risk tolerance.