This article solves one problem: reading charts. What each candlestick says, how to pick timeframes, how to use moving averages, how volume confirms price, and how chart types differ. Finish it and you can read markets hands-on in Kline Buty.
Disclaimer: All content on this site is for learning and research only and does not constitute investment advice. Markets carry risk; invest with caution.
1. A Single Candlestick: The Four Prices
One candlestick records the price action of one period and is built from four prices:
| Element | English | Meaning |
|---|---|---|
| Open | Open | The first traded price of the period |
| High | High | The highest traded price of the period |
| Low | Low | The lowest traded price of the period |
| Close | Close | The last traded price of the period |
1.1 Anatomy of a Candlestick
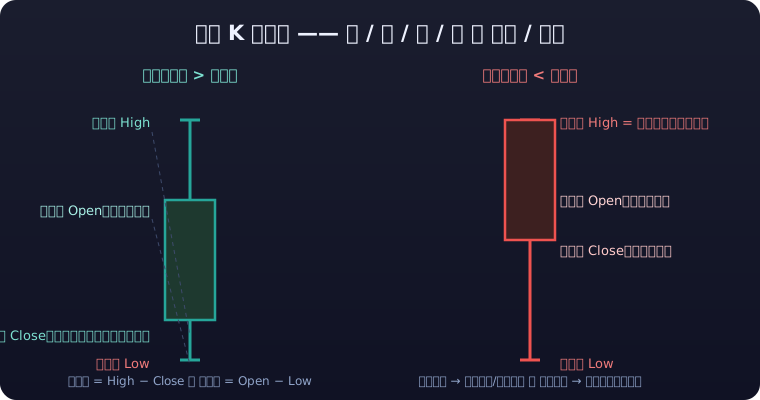
- Body: the rectangle between open and close, the final range of the bull-bear fight in that period.
- Wicks (shadows): the thin lines above and below the body (upper/lower shadow), marking the extremes the price touched intraday.
- Upper wick = High − max(Open, Close); lower wick = min(Open, Close) − Low.
1.2 Bullish and Bearish Candles
| Type | Condition | Appearance | Meaning |
|---|---|---|---|
| Bullish candle | Close > Open | Hollow/red body (conventions differ by region) | Bulls won the period |
| Bearish candle | Close < Open | Filled/green body | Bears won the period |
Chinese terminals conventionally use red-up, green-down; international software (TradingView etc.) uses green-up, red-down. Neither is wrong — it is pure convention. Kline Buty follows the theme you pick.
1.3 What One Candlestick Tells You
- Longer body: one side dominated the period more decisively.
- Longer upper wick: heavy selling above; the rally was knocked back down.
- Longer lower wick: strong buying below; the selloff was caught.
- Doji (Open ≈ Close): bulls and bears in a tug-of-war, direction unclear, often a reversal warning.
One-line example: a small bearish candle with a long lower wick = a deep intraday drop bought back up by the close — evidence of support at the lows, and a possible turn to strength.
2. Timeframes and Time Structure
2.1 What Is a Timeframe (Interval)
A timeframe = the length of time each candlestick represents. 1m means each candle packs 1 minute of data; 1d means each packs one day.
| Timeframe | Name | Typical use |
|---|---|---|
| 1m / 5m | Minutes | Scalping, bounce trades, moment-by-moment trading |
| 15m / 30m | Short | Intraday swings |
| 1h / 4h | Hours | Short-term to swing trading; the crypto workhorse |
| 1d (daily) | Daily | Swings and trend calls; the mainstream default |
| 1w (weekly) | Weekly | Medium-term trend filter |
💡 Kline Buty tip: on mobile, the timeframe bar wraps to show all 14 timeframes (1s to monthly) with no horizontal scrolling — every timeframe is one tap away, even on narrow screens. Desktop keeps a single compact row, with low-frequency options tucked into the "More" panel.
2.2 How Timeframes Relate
- One 1h candle = the aggregate of sixty 1m candles (open = first 1m open, close = last 1m close, high/low are the extremes of the range).
🧭 Multi-timeframe iron rule: higher timeframe sets direction, lower timeframe finds entries
Higher timeframe sets direction, lower timeframe finds entries — when the daily trend is up, hunting pullback entries on 1h/15m gives a far better win rate than fighting the daily trend for bounces. Fighting the higher timeframe for counter-trend bounces is the most common way retail traders lose money.
- Higher timeframe for direction, lower timeframe for entries: with the daily trend up, pullback entries on 1h/15m beat counter-trend bounce trades against the daily.
- Smaller timeframe, more noise: most "breakouts" on a 1m chart are fake; daily/weekly signals are more reliable but slower.
2.3 Combining Timeframes (Nested Frames)
The standard approach is the "three-timeframe read", for example:
Weekly: set the major trend (filter; trade only with it)
  ↓
Daily: define the trading range and key levels
  ↓
1h/15m: pinpoint entries and **<mark>stop-loss</mark>** placement
One-line example: weekly uptrend, daily pullback into support, 1h prints a stabilizing bullish candle → both win rate and risk-reward are favorable; if the weekly is a downtrend, treat every daily bounce as watch-only.
3. Moving Averages: MA and EMA
3.1 What a Moving Average Is
A moving average = a line connecting the average close over a chosen window, used to smooth noise and reveal trend direction.
3.2 MA (Simple Moving Average, SMA)
MA(n) = (sum of closes of the last n candles) ÷ n
Worked example: the last 5 daily closes are 10, 11, 12, 13, 14 → MA(5) = (10+11+12+13+14) ÷ 5 = 12
3.3 EMA (Exponential Moving Average)
- Gives recent prices a heavier weight, reacts faster than MA, and turns earlier at inflection points.
- The formula recurses daily (with a smoothing factor) — you never compute it by hand. Just know: most default indicators on terminals are EMAs; the larger the parameter, the smoother and the slower.
3.4 Common Ways to Use Moving Averages
| Usage | Description |
|---|---|
| Direction filter | Price above a rising MA → bullish trend; the reverse → bearish |
| Support / resistance | Pullbacks into a rising MA often find support; rallies into a falling MA often stall |
| Golden cross / death cross | Fast MA crossing above slow = golden cross (bullish bias); below = death cross (bearish bias) |
| Common sets | MA(5,10,20), MA(50,200), and the crypto favorite EMA(20,50) |
⏱ Moving averages are lagging indicators
Moving averages describe the past; they do not predict the future. A golden cross forms only after a chunk of the rally has happened, and chasing crosses often buys short-term tops. Treat MAs as a "trend filter", not a "signal generator".
4. The Volume Sub-Panel
4.1 What Volume Is
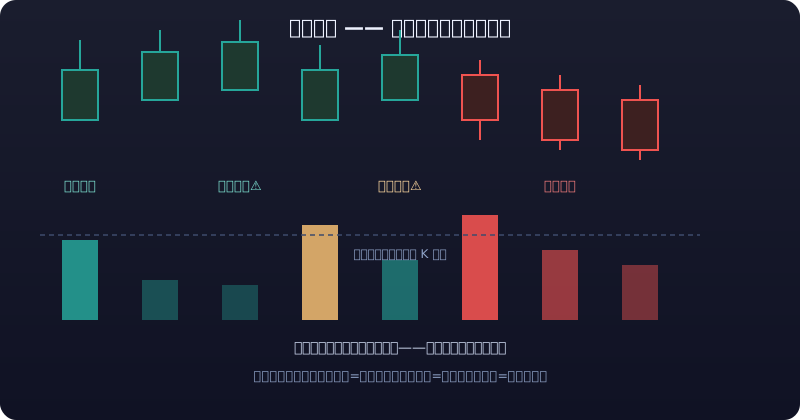
Volume = the total quantity traded in the period (shares for stocks, coins for crypto). In the sub-panel each candle gets a bar beneath it, and bar height = trading activity.
4.2 Reading Volume-Price Combinations
| Pattern | Meaning |
|---|---|
| Up move + expanding volume | Genuine bullish force; the trend is more trustworthy |
| Up move + shrinking volume | Weak follow-through buying; the bounce may stall |
| Down move + expanding volume | Panic selling; there may be lower lows |
| Down move + shrinking volume | Selling pressure exhausting; near a bottom |
| Heavy volume, flat price | Huge disagreement between bulls and bears; watch for a top |
4.3 Advanced Clues
- Volume-price divergence: price makes a new high but volume does not → upward momentum is fading.
- Volume at key levels: breakouts/breakdowns on expanding volume are more reliable; low-volume breakouts are often fake.
- High-volume lower wick: huge buying into a crash is a classic panic-bottom signature.
⛽ Volume is the "fuel" of price
Volume is the "fuel" of price — moves without volume do not travel far. For the full volume-price framework see Technical Analysis.
5. How to Choose a Timeframe
The choice depends on trading style and holding period, not on "which is better":
| Your style | Main timeframe | Auxiliary | Holding period |
|---|---|---|---|
| Scalping / bounce trades | 1m / 5m | 15m | Minutes to hours |
| Intraday swings | 15m / 1h | 4h | Several hours to 1 day |
| Short-term swings | 1h / 4h | 1d | 1–5 days |
| Medium to long term | 1d / 1w | 4h | Weeks to months |
Selection principles:
- Match the timeframe to your daily rhythm — someone who cannot watch screens at work should not trade off 1m charts.
- Enter on the smaller timeframe, but always ask the bigger one for direction first.
- A signal on one timeframe deserves confirmation from at least one higher timeframe before you act.
- Do not timeframe-hop: bouncing between charts at the same moment only feeds you contradictory signals.
6. Common Chart Types
| Type | Construction | Strengths | Weaknesses | Best for |
|---|---|---|---|---|
| Candlestick | Body + wicks | Most complete info (OHLC) | Dense; can overwhelm beginners | The default; most scenarios |
| Line chart | Close prices connected | Minimal; clean trend view | Loses high/low info | Quick long-term trend checks |
| Area chart | Line + fill below | Visually intuitive | Same as line | Presentations |
| Bar chart (OHLC) | Horizontal ticks for open/close, vertical for high/low | Same info as candles | Less intuitive than candles | Classic Western platforms |
| Renko | Fixed-size bricks | Filters noise, draws only trend | No time axis; no session view | Trend-following specialists |
| Point & Figure | X/O marking reversals | Pure price action | Steep learning curve | Dedicated price-action analysis |
| Mountain/valley charts | Close with high/low stitched | Good for ranges | Less detail | Range assessment support |
Beginner advice: use candlesticks 90% of the time and just know the rest exist. Advanced types like Renko are covered in Technical Analysis.
7. Quick Recap
- One candlestick = open, high, low, close; the body shows the bull-bear verdict, the wicks show the intraday battle.
- A timeframe is "time granularity": higher timeframe sets direction, lower timeframe finds entries.
- MA is a simple average; EMA weights recent prices more. Both lag — use them as filters.
- Volume-price: expanding-volume rallies are trustworthy, shrinking-volume rallies are suspect, expanding-volume declines are panic, shrinking-volume declines are near their end.
- Timeframe choice follows trading style: pick the direction timeframe first, then the entry timeframe.
- Candlesticks are the default chart; the other types each have their niche — switch as needed.
Next step: after this article you can practice in Kline Buty right away; for candlestick patterns, combinations, and the full indicator system, see Technical Analysis.
⚠️ Risk Warning
Candlesticks and indicators are descriptive tools, not forecasting tools. Reading charts does not equal profiting — chart-watching without stop-losses and position management just gives your losses a technical gloss.