Drawing is the only way to translate "the price structure you understand" into "a verifiable hypothesis on the screen". Horizontal lines mark support/resistance, trend lines mark rhythm, channels mark boundaries, Fibonacci marks retracement targets, XABCD marks harmonic structure — the tools themselves have no predictive power; the quality of a drawing depends on "why you drew it here", not "how precisely it is drawn".
💡 One-Sentence Summary
One-sentence summary: drawing exists to give trading decisions a "frame of reference" and "invalidation conditions", not to produce pretty shapes. A line without a corresponding stop-loss level or observation level is decoration.
1. The Essence of Drawing: Translating Structure into Hypotheses
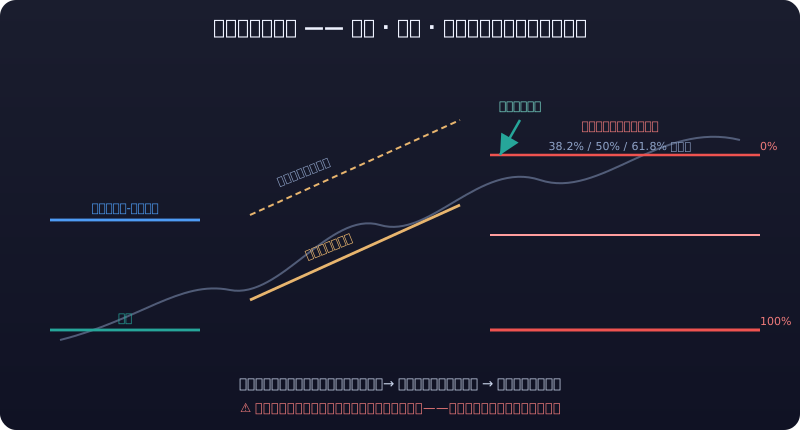
There are hundreds of drawing tools in technical analysis, but every tool essentially does one of three things:
| Tool class | Question it answers | Typical tools |
|---|---|---|
| Positioning | "Where are the important price levels/times?" | Horizontal line, vertical line, price label |
| Connection | "What is the rhythm/boundary/trend of this move?" | Trend line, ray, channel, speed lines |
| Proportion | "Where are the retracement/extension/pattern targets?" | Fibonacci family, XABCD, Gann |
The three levels of correct usage:
- Describe (lowest): draw the structure that already happened — anyone can do this, but it has only "hindsight verification" value;
- Presuppose (middle): have a view before drawing ("this is resistance at the prior high"); the line is just the visualization of that view;
- Trigger (highest): the line gives explicit trigger conditions — breakout/breakdown/retest confirmation, executed together with the risk control of the 07 · Trading Systems chapter.
Interaction conventions (common to all tools; not repeated below): every anchor is draggable for fine-tuning; a selected drawing can be dragged as a whole; hit-testing differs by shape — segment-type tools hit by distance to the segment, band/channel/range-type tools hit by area (any point inside the band is clickable), and once hit the object is selected and editable. Layer organization (hide/lock/delete) is covered in 5.10.
⚠️ Red Line
The vast majority of beginners die from "drawing first, finding reasons after". The correct order is always: form a hypothesis first → mark its key levels with drawings → wait for price to verify or falsify it.
2. Positioning: Support/Resistance and Key Levels
2.1 Horizontal Line
The horizontal line is the single most important tool; what it draws is not "a line" but a price anchor:
- Where to draw: prior highs/lows, round-number gates, edges of high-volume nodes (with the volume profile from 03 · Volume-Price Analysis), near long-term moving averages;
- How to use: the first touch is usually just a "test"; the second/third touch is where the real battle happens — the more touches and the longer price lingers, the more "gold" the line carries;
- Invalidation: after an effective close-through break (usually 1.5%–3% or 1 ATR; see the ATR section of 02 · Technical Indicators in Depth), support becomes resistance and resistance becomes support.
2.2 Price Label and Vertical Line
- Price label: pins "the level I currently consider important" directly on the chart. Label only 3–5; labeling everything equals labeling nothing;
- Vertical line: marks time, not price — earnings days, CPI releases, delivery dates, large unlock dates. For event-driven usage see the event-driven section of 11 · Trading Practice.
3. Connection: Trend and Rhythm
3.1 Trend Line
A trend line connects two or more significant lows (uptrend) or highs (downtrend):
- Minimum two points, the third confirms: two points make a line but only a "guess"; a third touch that holds is what earns respect;
- The meaning of slope: the steeper the slope, the faster it tends to fail (steep trend lines, once broken, usually lead to outright reversal rather than sideways); the gentler the slope, the longer the reference value lasts;
- Drawing principle: connect body edges (wick piercings are normal — don't force connections to wick extremes), and prefer lines "tested multiple times".
3.2 Ray and Polyline
- Ray: extends infinitely to the right from its origin — fits "start from a historical key level and project the future extension direction", e.g., drawing a ray from a major bottom to see the current trend's extension boundary;
- Polyline: manually "straightens" a complex move into segments for structural review (which leg was the markup, which the correction); not suitable as a direct trading trigger, because you chose the anchors yourself — inherently subjective.
3.3 Arrow
The arrow is "annotation", not "analysis": mark on the chart "this breakout was valid" or "this was a false breakout". Best used with the screenshot-sharing feature — during review, arrows + text reconstruct what you were thinking at the time; see the advanced trade-review section of 07 · Trading Systems.
4. Channels: Boundaries and Regression
4.1 Parallel Channel and Horizontal Channel
- Parallel channel: one trend line + one parallel boundary line framing a trend's "upper and lower rails". Usage:
- Buy the lower rail, sell the upper rail, stand aside at the middle (oscillating channel);
- A channel break ≠ chase immediately: after a break, a "retest confirmation" before continuation is common; chasing directly gets harvested by false breakouts;
- Horizontal channel: two horizontal lines framing a sideways range (a box). The box's value lives on its edges: buy the lower edge, sell the upper edge; after the box breaks, the old box becomes a "support/resistance shelf".
4.2 Regression Channel and Speed Lines
- Regression channel: runs a linear regression over all candles in the range and draws "best-fit midline ± standard deviation" rails. More objective than hand-drawn channels — it doesn't depend on your shaky anchor choices; well suited to verify "is the current trend still running on one side of the midline";
- Speed lines: divide the A→B advance into thirds and draw 1/3 and 2/3 speed lines. Use: in a trend, a pullback holding the 1/3 line is usually strong consolidation; losing the 2/3 line often means the trend is accelerating downward. A "secondary reference" — mediocre signal quality on its own.
5. Proportion: The Fibonacci Family
5.1 Fibonacci Retracement
The most-used item: from one significant swing (e.g., low → high), pull the 0.236/0.382/0.5/0.618/0.786 retracement levels:
- 0.618 is the "golden level": a pullback to 0.618 that holds → healthy trend; a close below the 0.618 retracement → the original trend most likely weakens;
- Usage: at retracement levels (especially near 0.382/0.5/0.618) wait for stabilization signals (e.g., hammer/engulfing from 01 · Candlestick Patterns + expansion) — do not place orders directly at the levels;
- Common mistake: treating retracement levels as "exact points" instead of "fuzzy zones". ±1% around 0.618 all counts as valid; chasing two decimal places of precision is self-deception.
5.2 Fibonacci Extension / Fan / Time Zones
- Extension (Fib Extension): projects post-breakout targets (1.272/1.618/2.618). Use: a take-profit reference, not "a price that must be reached" — near the target, scale out and trail the stop up;
- Fan (Fib Fan): radiates ratio lines of different slopes from the origin, used to judge the "angle class" of a trend pullback;
- Time zones (Fib Time): draws vertical lines at golden-ratio divisions of the time axis to project "regime-change time windows". Honest assessment: time tools' win rate is close to random — better used as "raise alertness when the time point arrives" reminders than as trading signals.
5.3 Cycle Lines
Cycle lines take the first anchor A as origin, treat the A→B interval as one cycle, and extend 12 equidistant vertical lines to the right (a solid line at A, then dashed lines with +1/+2… sequence labels). Good for:
- Watching whether the rhythm "recurs": start A at an obvious swing low, measure to the next similar low B; the extended lines land on later "potential in-phase turning points";
- Cross-verification with Gann/Fibonacci time lines: different time tools resonating on the same day deserve extra alertness;
- Detecting cycle drift: if turns keep landing "a few days late" versus the extensions, the cycle is lengthening — don't mechanically bottom-fish on the original cycle.
5.4 Fib Channel
The Fib channel = one base trend line + a set of channel lines offset in parallel by Fibonacci ratios. After dragging A→B to define the swing (base line), the system treats the A→B swing as 1× and generates 8 parallel ratio lines at 0.236/0.382/0.5/0.618/0.786/1/1.272/1.618 on both sides, spanning the full visible width:
- Direction-sensitive: when A→B swings up, the ratio lines extend proportionally above the base line (pullback/extension targets); a downward swing mirrors them below. Clicking A first then B sets the channel's orientation — consistent with the "start and end set direction" logic of Fibonacci retracement;
- Key ratios: 0.382/0.618 are the pivots "most tested by retests inside the channel"; 1.272/1.618 become the extension target band after the channel breaks (like the extension tool); 0.236 is the watch level for "shallow pullbacks" in strong trends;
- Usage: while price runs inside the channel, the lower/upper rails are zone boundaries, not exact points; after an effective break, the old boundary flips into support/resistance and the extension levels (1.272/1.618) are references for scaling out;
- Difference from the parallel channel: the parallel channel draws only equal-width rails (assuming constant swing size), while the Fib channel maps the golden ratios of the same swing into multiple parallel lines — better for "after one markup wave, judging pullback depth and extension targets".
Honest assessment: channel spacing is set by the A→B swing size — the longer the anchors, the wider the channel and the lower the reference value (it can wrap almost any market). Draw on "structurally clean swings" first, not force-fit onto chop.
5.5 Wedge
The wedge uses three converging edges to describe the "compression" late in a trend: points 1/2 are the origins of the two edges, point 3 is the convergence point, and the two edges continue as dashed projections beyond it. Two kinds by direction:
- Rising wedge: both edges slope up and converge; common in late-stage advances — bull strength decaying, new highs on flattening slopes; losing the lower edge is a bearish signal;
- Falling wedge: both edges slope down and converge; common in late-stage declines — bear strength exhausting; clearing the upper edge is a bullish signal.
Usage:
- Don't act inside the wedge: convergence means the range is narrowing and direction is undecided before the break — blind fade trades get slapped;
- Trade the breakout direction: a rising wedge losing its lower edge (with expansion) is bearish; a falling wedge clearing its upper edge (with expansion) is bullish; false breakouts are common at wedge ends — entering after a retest confirmation is steadier;
- Meaning of the convergence point: the closer the edges to the apex, the nearer the regime change — treat the area around the apex as a "time warning zone";
- Difference from triangle/channel: a triangle is a "converging pattern"; a wedge is a "directionally tilted triangle"; channel edges are parallel (constant swing size) while wedge edges converge (shrinking swing size).
Honest assessment: the wedge is one of the most abused shapes — in chop, a casual drag produces "wedges" everywhere. Use it only in structurally clean late-trend phases (a clear prior impulse + visibly slowing slope now), and always give the wedge a breakout-confirmation invalidation condition (e.g., an effective close-through + 1 ATR).
5.6 Parallel Ray / Width Channel
These two tools serve the same need: after drawing one trend line, quickly replicate "same slope, different location" reference lines.
- Parallel ray: click A, B to define direction, then C as the ray origin — the system extends a ray from C, exactly parallel to A→B, infinitely to the right (A→B shown as a thin dashed direction line). Typical use: "carry" the slope of a main trend to another price level and watch whether same-slope, different-level action recurs (e.g., shifting the prior-high trend line down to the current low as a support reference);
- Width channel: click A, B to define the base direction, then C to set the channel width — the system draws two infinite parallel lines through A and through C, with a dashed line marking the B→C width. Difference from "parallel channel": the parallel channel's width is fixed by the A→B price gap, while the width channel's width is freely set by the third point C — better when "each edge should hug a separate swing".
Usage:
- Parallel ray = slope transfer: define the slope on a clear impulse A→B, then shift it to the key level you care about (prior high/low, round-number gate). Do not keep re-transferring a slope in markets where it has already failed — trend-line slope itself changes across markup/markdown legs;
- Width channel = edge hugging: C should sit on "the high/low of another real swing", letting the rails hug real action — not a casually dragged width; the channel's reference value depends entirely on whether C hugs real structure;
Honest assessment: parallel tools are natural extensions of the "trend line" and generate no new information — they only replicate the slope of existing structure. The genuinely effective use: A→B defines a large-degree reliable trend, C lands on a small-degree key level, forming a "big slope + small location" combined observation — not doodling two parallel lines on a 5-minute chart for self-amusement.
5.7 Trend Angle / Time Range
These two tools make "slope" and "time window" explicit — auxiliary observation drawings: they add no structure, but annotate quantitative information you could already see but tend to overlook.
- Trend angle: drag A→B to draw a segment; the system draws a small arc at the A end and labels the angle relative to horizontal at the midpoint (screen space; positive upward, negative downward, range −90°~+90°). The two points are time-ordered (left first), and once selected the whole line can be dragged or anchors fine-tuned;
- Time range: drag A→B to frame two time points; the system draws a semi-transparent vertical band on the main chart (left/right borders + a top date-range label "start ~ end"). Anywhere inside the band is clickable — good for marking "event windows", "earnings/data release sessions", or "the time span of a completed structure".
Usage:
- Angle for comparing slope changes: the angle difference between markup legs and pullback legs quantifies quickly — e.g., "this rally runs at 38° versus 52° for the last one, a clear slowdown" — more objective than eyeballing two lines. Note: the chart's horizontal axis (time) and vertical axis (price) have different dimensions; the angle is a screen-space value that changes with chart width/zoom — compare only within the same view;
- Time range as "time anchors" for the chart: make the borders land on key time points (pattern start/end, major news moments), not a casual drag — a range's value lies in "what happened during this window".
5.8 Price Band
The price band is the horizontal twin of the time range: the time range paints "a period" as a vertical band; the price band paints "a price span" as a horizontal band across the whole chart.
- Dragging: drag A→B (vertical span); the system normalizes the two points by price order (lower price on top edge, higher price on bottom edge) and draws a semi-transparent horizontal band — two border lines spanning the full width, each with a price label on the left (
toFixed(2)); - Typical use: marking high-volume zones / support-resistance bands / target-price zones — e.g., "64_000~64_300 below is the last two weeks' high-volume band; losing the lower edge means the bulls' line has failed". It expresses "a zone" better than a single horizontal line, and fits "care only about price, not the time window" better than a rectangle.
Honest assessment: the price band is the zonal expression of support/resistance and predicts nothing. Its value is correcting the "one line misread as an exact value" trap into "this is a fuzzy zone" — price weaving inside the band is normal; what carries signal meaning is the break/loss of the band edges (read together with volume and the volume profile).
5.9 Fib Time Zones
Fib time zones are the Fibonacci version of cycle lines: drag A→B to set the base period (A as origin, the A→B interval as the base); the system draws boundary lines to the right of A at Fibonacci multiples (1, 2, 3, 5, 8, 13, 21, 34, 55…) and fills alternating semi-transparent vertical bands between adjacent boundaries — laying "Fibonacci days/weeks" time windows intuitively on the chart.
- Dragging: drag A→B (horizontal span); A is the origin and B only fixes the base length; boundaries fall at 1×, 2×, 3×, 5×, 8×, 13×, 21×, 34×, 55× the base from A (the first n=1 line solid, the rest dashed), with multiple labels on top;
- Direction-sensitive: like cycle lines, the two points are order-preserving — A on the left extends right, A on the right extends left; flipping the drag direction mirrors the zones and won't auto-normalize away your intent;
- Typical use: marking Fibonacci time windows — set A at the start of a significant trend and the base as "one complete swing"; the subsequent boundaries are the theoretical time nodes prone to regime changes/turns. Good for reviewing "did the last few highs/lows land near boundaries" and for pre-marking "where the next time window is" while a trend runs.
5.10 Layer Management: Hide, Lock, and Clear
As drawings accumulate, the chart fills with "old stale lines" — not every line deserves deletion, but not every line deserves to be always visible and clickable either. Layer management answers "how to organize once lines pile up": each line can be hidden (not rendered, not hit-testable) or locked (still rendered, but not selectable or draggable), and can be deleted individually or cleared in one shot.
- Hide (👁/🚫): a hidden line disappears from the chart and no longer participates in any hit testing — it is merely "archived"; the stored data remains and it can be shown again anytime. Suits lines "not needed now but needed for later review" (e.g., the multiple parallel channels of some historical swing);
- Lock (🔓/🔒): a locked line still renders (the structure stays on chart as reference) but can't be clicked or dragged — mouse/touch on it selects nothing, so no accidental drags. Suits key levels "already confirmed, reference only" (e.g., weekly-degree trend lines), protecting them from accidental bumps during daily zoom/pan;
- Per-row delete (🗑): deletes just that one; clear all wipes every drawing of the current pair. Deletion is irreversible — think before clearing;
- Row selection state: clicking a row in the panel selects the corresponding drawing on chart (blue + anchors), making it easy to locate a line from the list;
- Entry: a "Layer Management" button (with current count) inside the "Drawings" collapsible panel on desktop/mobile; click to open the list.
Honest assessment: layer management is a pure organization tool that generates no analytical signal — what it prevents is "too many lines polluting the view" and "accidentally dragging key levels". Hidden ≠ deleted (data remains, recoverable anytime); locked ≠ invisible (structure remains, just not operable). Sensible usage: lock key levels, hide process lines freely, delete dead lines promptly; leave the chart face to the structures actually in use, and delegate the rest to the layer list.
5.11 Risk/Reward (R:R)
Risk/reward is the most "trader-flavored" auxiliary tool: it lays the entry, stop, and target prices on the chart at once and auto-computes the payoff ratio — an intuitive yardstick for position sizing and "is this trade worth taking".
- Drawing: click three points in sequence — A entry → B stop → C target (the order is the semantics; the system preserves order and never re-sorts); three horizontal lines spanning the full width appear: entry solid, stop/target dashed (all turn blue when selected), each with a price label on the left, and a payoff-ratio label (
1:{ratio}) near the entry line on the right; - Algorithm:
risk = |A − B|(entry to stop distance),reward = |A − C|(entry to target distance),ratio = reward / risk; when the stop equals the entry (risk=0), ratio records 0 without crashing — also a reminder that "a trade without a stop has no payoff ratio to speak of"; - Typical use: before placing the order, lay out on the chart "where I exit if wrong, where I exit if right" and see at a glance whether R:R ≥ 2 (usually at least 1:2 to justify the risk); also good for review — losing trades are often not wrong on direction but on an inverted payoff ratio (taking trades where reward is far smaller than risk).
Honest assessment: R:R is a risk-control-first tool, not a prediction tool — it doesn't tell you "will it rise"; it puts "how much if wrong, how much if right" on the table. A pretty payoff ratio still loses if the win rate is too low; real position decisions combine R:R with the win rate to compute expectancy (EV = win rate × reward − loss rate × risk). No stop, or a carelessly tight stop (swept by normal volatility), are the most common misuses of the R:R tool.
6. Shapes: Rectangle / Ellipse / Circle / Triangle / Arc
Shape tools are auxiliaries that "turn what the eye sees into a measurable object":
| Tool | Use | Discipline |
|---|---|---|
| Rectangle | Frame a range/consolidation platform | Only the edges matter; don't trade inside |
| Triangle | Frame a converging/diverging pattern | The breakout direction matters more than the shape |
| Ellipse/circle/arc | Mark arc structures (rounding bottom/top) | Most subjective; review annotation only |
Core reminder: the "shape" drawn by these tools only has operational value together with the confirmation signals of 04 · Advanced Candlesticks (breakout + volume + retest). A bare triangle outline says nothing.
7. Structure: XABCD Harmonics / Elliott Waves / Gann Angles
7.1 XABCD Harmonic Pattern
Harmonic patterns use five points X→A→B→C→D to describe price structures with specific ratios (Butterfly, Bat, Crab, Gartley, etc.); the core is the Fibonacci ratio relationships between legs:
- Usage: find patterns where XA, AB, BC, CD satisfy the classic ratios (e.g., AB ≈ 0.618 of XA, BC ≈ 0.382–0.886 of AB, CD ≈ 1.272–1.618 of BC), then look for reversal signals near D;
- Controversy and traps:
- All five points are adjustable in hindsight; win rates are inflated in samples with "pattern first, price after";
- Always wait at D for "reversal confirmation" (reversal candle + volume); never counter-trend bottom-fish or top-pick just because "the ratios arrived";
- Recommendation: treat it as a detector of "potential reversal zones", not a precise entry trigger.
7.2 Elliott Wave
The full mechanics of the five-wave structure (1–5 impulse + A–C correction), the three iron rules, and the "thousand people, thousand counts" controversy are covered in 05 · Elliott · Gann · Chan. Practical drawing points:
- Use the 5-point tool to mark the ends of waves 1–5 in order — write down your wave-count hypothesis before drawing;
- Iron-rule check: wave 2 doesn't break wave 1's start, wave 3 isn't the shortest, wave 4 doesn't overlap wave 1 — any violation means recount;
- The right mindset: wave counting is a "descriptive framework"; the tool's value is forcing you to think clearly about "where we are", not handing you deterministic buy/sell points.
7.3 Gann Fan
Nine angle lines from 1×8 to 8×1 out of an origin, representing the "time × price" speed scale:
- The 1×1 line (45°) is the key reference: price above it → bullish strength; below → weakening;
- Controversy: the angles depend on axis scaling (stretching the chart wider/taller changes all the angles), so Gann lines "morph" across software and zoom levels — always use them within the same coordinate frame, as a trend-speed reference only, never as precise signals.
7.4 Gann Box
The Gann box is the "zonal" version of the fan: drag A→B to frame a rectangle, and 10 angle lines are auto-drawn inside — 1×1 double diagonals (bold) + 1×2 / 2×1 from the four corners.
- Usage: after framing a consolidation range, watch price's "angle rhythm" inside the box — riding 1×1 = equilibrium; losing it and switching to 2×1 support = deceleration; steep climb along 2×1 = acceleration leg (beware the emotional climax);
- Resonance: spots where the box's 1×1 diagonal / upper edge overlaps Fibonacci 0.5/0.618 or channel boundaries carry more reference value;
- For the full practice (including time-price balance and common mistakes), see 08 · Gann Box and Angles in Practice.
8. Annotation: Measure and Text
8.1 Measure
The measure tool shows the price gap and percentage change between two points; best for:
- Measuring "breakout height": from the box top to the target, for estimating the equal-move objective after a break;
- Measuring "pullback depth": quickly judging whether the current pullback is 0.382 or 0.5, cross-checked with Fibonacci;
- Measure gives numbers, not opinions — numbers only mean something inside your trading plan.
8.2 Text
Text annotation is the number-one productivity tool for review: write on the chart "why I bought here", "what I overlooked then", "which link of this trade lost money". Keep a "chart + words" double record for every trade; reviewing a month later exposes your decision holes better than any indicator.
Kline Buty's text annotation supports multi-line text (Enter for newline / ⌘+Enter to confirm), with font size (A−/A+) and color adjustable in the edit panel (theme yellow by default, or blue/red/green/white/purple) — use colors to grade annotations (e.g., red = risk, green = opportunity), so one glance during review separates "plans" from "warnings". The whole text box is click-selectable (not just the anchor), easy to revise or delete later.
9. The Discipline of Drawing: From "Can Draw" to "Can Use"
9.1 Three Iron Rules for Anchor Selection
- Anchors must come from significant structure: prior highs/lows, volume-heavy tops/bottoms, long-consolidation boundaries — never random swing extremes;
- Fewer anchors, more credibility: a trend line needs 3+ tests to have value; frequent redraws mean you are "accommodating the market";
- Multi-timeframe alignment: a line drawn on the daily should still "mean something" on 4H/1H — big-timeframe anchors stay valid on smaller ones, not vice versa (method in 04 · Advanced Candlesticks).
9.2 Every Line Must Have an "Invalidation Condition"
After drawing any line, ask yourself three questions:
| Question | Consequence of having no answer |
|---|---|
| What view does this line represent? | It's decoration — delete it |
| What do I do when price hits the line? | No trigger plan = not drawn at all |
| What price action proves this line wrong? | No invalidation condition = you will hold losers forever |
💡 The Ultimate Test of Drawing
The ultimate test of drawing: cover all the lines on the chart; if you can still say "where is support, where is resistance, where is my stop, what counts as wrong", the lines are valid; if you can't, they are psychological comfort.
9.3 Common Mistakes Checklist
- ❌ Over-drawing (more than ~10 lines per screen): information overload equals no information;
- ❌ Repeatedly moving anchors to "fit" the market: this is drawing-tool overfitting — the same disease as the backtest overfitting covered in 06 · Critique and Validation;
- ❌ Treating retracement/target levels as exact prices: they are zones, not points;
- ❌ Replacing risk control with drawing signals: however good the structural call, the stops/position rules of the 07 · Trading Systems chapter are the backstop.
9.4 Mobile & Touch Interaction Differences
Touch has no hover state, so the interaction mindset differs from desktop — four differences worth knowing:
- Two-step editing: desktop separates select vs. edit via "hover + click"; touch switches to "tap to select → drag to edit" to avoid accidental touches;
- Auto-return to "mouse" after each drawing: on mobile, every completed drawing (including text confirmation) switches the tool back to "mouse" — right after drawing, the finger most likely wants to fine-tune, not draw another; leaving the tool active invites accidental creation; desktop keeps continuous drawing;
- Double-click / long-press to rewrite text: desktop double-clicks the text body, mobile long-presses it (~250ms) to open the editor directly — no panel needed; works only in "mouse" read-only mode, so it never clashes with drawing gestures;
- Reading data in comfort: after dragging or long-press pinning, the crosshair lingers about 2 seconds on release (a tap or any new gesture clears it at once), and the OHLC tooltip flips at container edges to stay fully inside the viewport — even drags in the mid-lower chart can read the last row.
10. Summary: The "Dao" and "Shu" of Drawing
| Level | Content | Corresponding tools |
|---|---|---|
| Shu (how to draw) | Anchors from significant structure, multi-point confirmation, multi-timeframe alignment | Trend lines/channels/Fibonacci |
| Fa (how to use) | Hypothesis first, zones not points, explicit invalidation conditions | Horizontal lines/XABCD/measure |
| Dao (why) | Drawing is the visualization of thinking, not a prediction grail | All tools |
Read this chapter's discipline together with 07 · Trading Systems and 08 · Pitfalls; only then does drawing graduate from "decoration" to "decision".
Conventions
- All prices and figures in this article are illustrative and represent no specific instrument or market.
- The exact interactions of each drawing tool (anchor count, drag method) are governed by the actual Kline Buty interface.
- Fibonacci ratios and harmonic-pattern ratios are "statistical tendencies", not laws; before use, understand the validation methodology of 06 · Critique and Validation.
- For counter-trend trades (e.g., harmonic D-point bottom-fishing), be sure to read the margin and liquidation sections of the 03 · Futures chapter first.
⚠️ Risk Warning
Drawing is a subjective tool: two people can draw exactly opposite trend lines on the same chart. Its value lies in disciplining your plan, not predicting the market — however beautiful a counter-trend bottom-fish looks, compute margin and liquidation price first.