An industry is not a monolith but a value chain divided among upstream, midstream, and downstream: raw materials at the top, manufacturing in the middle, brands and channels at the bottom. Profit is not evenly distributed — within the same industry, different segments differ wildly in their ability to earn. This article covers industry chain structure, the smile curve of profit distribution, the investment logic for each segment, the "sell shovels" logic, and industry chain research methods, closing with a full hands-on walkthrough of the AI compute chain.
1. What Is an Industry Chain
The upstream–midstream–downstream value chain structure
| Segment | What It Does | Typical Traits | Source of Profit |
|---|---|---|---|
| Upstream | Resources, raw materials, basic components | Capital-heavy, strongly cyclical, supply sets price | Resource endowment, supply-demand gaps |
| Midstream | Manufacturing, processing, assembly, contract production | Capital-heavy, fierce competition, utilization-dependent | Scale and cost, process barriers |
| Downstream | Brands, channels, end products, services | Asset-light, close to consumers | Brand premium, channel capability, demand insight |
Three questions to locate a company in the chain:
- How many steps from your product to the final consumer? (The farther away, the more upstream)
- Who holds pricing power? (Who decides what the end product sells for and what the raw material sells for)
- Where does added value occur? (Which segment earns above-average returns)
Profit flows along the value chain
Industry chain research has one core proposition: where does money come from, who holds it now, and where will it flow next. In an upswing, profit usually lands first on the segment with the tightest capacity; in a downturn it stays with whoever has the strongest bargaining power (closest to demand or holding a quasi-monopoly). Researching an industry chain means tracking where profit flows.
2. Three Classic Industry Chains Dissected
The smartphone chain
| Segment | Representative Activities | Profit Level | Landscape Traits |
|---|---|---|---|
| Upstream | Chips (SoC/memory/displays), optical lenses, CMOS sensors | High | Highly monopolized; head players take the lion's share |
| Midstream | Mainboards, batteries, structural parts, whole-device assembly | Low-to-mid | Fierce competition; assembly net margins in single digits |
| Downstream | Brands (Apple/Huawei/Xiaomi), channels, operating systems | High | Brand concentration; top brands capture most industry profit |
📖 The classic phenomenon of the Apple supply chain
In the Apple supply chain, whole-device assemblers (e.g., Foxconn) earn hard-earned money, while suppliers of core components — lenses, chips, displays — enjoy far higher margins than assembly: the added value sits not in assembly but in design and core components.
The EV chain
| Segment | Representative Player Types | Current Profit Traits |
|---|---|---|
| Upstream | Lithium mines, cobalt/nickel, cathode/anode/electrolyte/separator | Violent price cycles: windfall profits in 2021-2022, then retreat after overcapacity set in |
| Midstream | Battery makers, motors & controls, vehicle manufacturing | Batteries highly concentrated (CATL/BYD duopoly); vehicle assembly fiercely competitive |
| Downstream | Brand automakers, charging networks, mobility services | Brand divergence; intelligence, channels, and after-sales are the new profit battlegrounds |
The semiconductor chain
| Segment | Content | Barrier Traits |
|---|---|---|
| Upstream | EDA software, semiconductor equipment, photoresist/wafers and other materials | Highest barriers; chokepoint segments; long qualification cycles |
| Midstream | Wafer fabrication, packaging & testing | Massive capex; advanced nodes run by a duopoly |
| Downstream | Chip design (Fabless), end applications | Design firms are asset-light with high gross margins, but depend on foundries and IP licensing |
💡 One rule common to all three chains
The shared pattern: the further upstream, the more monopolized; the further downstream, the more fragmented (except consumer-facing terminal brands). For any industry chain, draw this structure first, then map profit onto it — get the structure right and half the analysis is done.
3. Profit Distribution Along the Chain: The Smile Curve
What the smile curve is
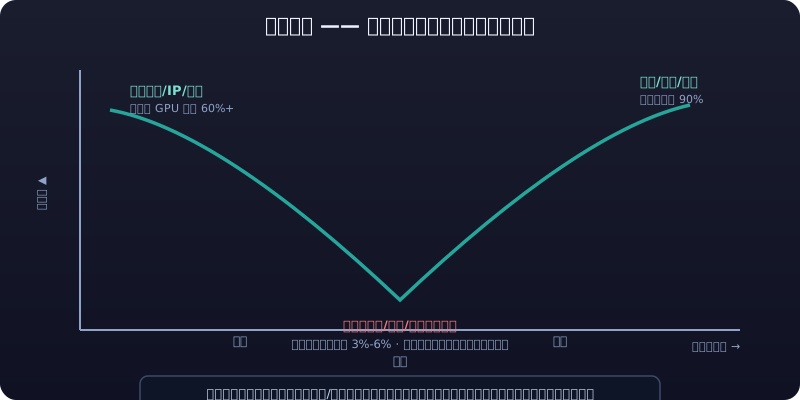
Acer founder Stan Shih proposed that value-added along an industry chain traces a "smile"-shaped curve — both ends (R&D/design, branding/marketing) are high-value; the middle (manufacturing/assembly) is lowest.
Why design, brand, and chips earn more
| Segment | Why It Earns More | Case Traits |
|---|---|---|
| Chips / IP / design | Patents form quasi-monopolies with near-zero marginal cost — selling one unit costs about the same as selling 100 million | NVIDIA GPU gross margins consistently above 60% |
| Brands | A brand premium is the trust cost consumers willingly pay extra — and it's nearly impossible to copy | Moutai's gross margin hovers around 90% |
| Channels / retail | They own the consumer entry point and extract payment terms and rebates from upstream | Top retailers' bargaining power over suppliers |
Why assembly earns less
- Low technical barrier: differences in assembly craftsmanship are hard to sustain; substitutability is high.
- Fully contested: anyone can do it, so price wars inevitably compress margins.
- Squeezed from both ends: upstream core components raise prices while downstream brands push them down; assembly passively absorbs both.
- Real-world picture: top contract manufacturers' net margins sit around 3%-6%, while brand and core-component players often earn several times that.
Using the smile curve for investment judgment: at comparable quality, companies closer to the "corners" of the curve (design/brand ends) carry economic moat premiums; those closer to the "chin" (manufacturing/assembly) depend on scale and efficiency. Exceptions exist — if the manufacturing side builds unique process barriers (precision manufacturing, proprietary materials), it can climb off the bottom of the curve.
💀 Iron rule: contract manufacturing earns hard-won money, not an economic moat
At comparable quality, companies nearer the "corners" (design/brand) carry moat premiums; those near the "chin" (assembly) rely on scale and efficiency. Top contract manufacturers net 3%-6% while brands and component makers often earn multiples of that — so "big scale" ≠ "big profits." In any value chain, first ask which segment captures the profit.
4. Investment Logic for Each Segment
Upstream: watch price and supply
| Watch Point | Content |
|---|---|
| Core variable | Product prices (spot/futures/contract prices) |
| Supply side | Timing of new capacity, mine/line build-out cycles, inventories |
| Demand side | Downstream operating rates, demand growth |
| Typical logic | Supply contraction (shutdowns, output curbs, mine accidents) + demand recovery = upward price elasticity |
| Risk | Price cuts both ways: windfall profits in an upcycle, but once supply is released, price and profit collapse together |
The essence of upstream investing is betting on the price cycle (see Article 04): buy when losses force capacity out, sell when windfall profits trigger expansion. For upstream companies, PE is a trap — product prices and spreads are the anchor.
Midstream: watch capacity and cost
| Watch Point | Content |
|---|---|
| Core variable | Capacity utilization, unit costs, expansion plans |
| Key question | Is industry capacity excessive? Are many new entrants coming? |
| Competitive strategy | Vertical integration to cut costs, economies of scale, process leadership |
| Typical logic | High utilization + stable landscape = volume and price rise together; overcapacity + price war = margins shaved |
| Risk | The midstream most easily shows "revenue growth without profit growth" — rising revenue cannot mask falling gross margins |
Downstream: watch demand and brand
| Watch Point | Content |
|---|---|
| Core variable | End sales volumes, penetration rate, brand share, channel inventory |
| Key question | Is demand a real breakout or short-term stimulus from subsidies/discounting? |
| Competitive strategy | Brand premium, channel density, repurchase rates and user stickiness |
| Typical logic | Rising demand + brand concentration = volume-price double gain, share and profit rising together |
| Risk | Sales data distorts easily under promotions and channel stuffing; "sell-through" is truer than "shipments" |
Quick-reference table across the three segments:
| Segment | Logic in One Line | Key Data | Key Risk |
|---|---|---|---|
| Upstream | Price and supply | Price, inventory, output | Price reversal |
| Midstream | Capacity and cost | Utilization, spreads, expansions | Overcapacity |
| Downstream | Demand and brand | Sales, penetration, share | Demand falsified |
5. The "Sell Shovels" Logic
What selling shovels means
In a gold rush, the steadiest money is not made by prospectors but by those selling shovels, water, and jeans — no matter who strikes gold, the toolmaker gets paid first.
| Mapping | Gold Rush | Modern Industries |
|---|---|---|
| Prospectors | Miners | Application/device makers (AI apps, carmakers, game studios) |
| Shovel sellers | Toolmakers | Compute equipment, semiconductor equipment, battery equipment, test instruments, materials suppliers |
| Trait | Winner takes all | Winners still take all, but toolmakers don't bet on any single player |
Three essentials of the shovel-seller logic:
- Don't bet on winners: you don't need to pick which AI application wins — as long as "everyone needs compute," compute-equipment and materials sellers benefit.
- Prosperity transmits early: when an industry takes off, capex hits equipment and materials first, so shovel sellers book orders earliest.
- But shovels also become oversupplied: after every capex frenzy, equipment and materials face overcapacity too — the shovel seller merely defers risk rather than eliminating it.
✅ Takeaway: the shovel seller defers risk rather than eliminating it
Shovel sellers only postpone risk; they don't remove it. After every capital-spending frenzy, equipment and materials face the same overcapacity — so "sell shovels" is not a sure-win grail but deferred gains ("earn first, give back later"). When prosperity ebbs, toolmakers get crushed by overcapacity just like everyone else.
Typical "shovel" segments
| Industry | Shovels |
|---|---|
| Semiconductors | Lithography/etching equipment, photoresist/wafer materials |
| New energy | Battery-manufacturing equipment, solar PV equipment (expansion phase), inverters |
| AI compute | GPU/AI chips, HBM memory, optical modules, liquid cooling, servers, data-center power and infrastructure |
| Innovative drugs | CXO (R&D outsourcing), lab instruments, consumables |
6. Industry Chain Research Methods
Method 1: Find the bottleneck
Every industry chain has a segment that acts as the "bottleneck" — everyone else waits for its capacity while it sets prices. Bottleneck = highest-margin segment = strongest bargaining power.
Criteria for identifying a bottleneck:
- A persistent supply-demand gap (utilization stays elevated);
- High technology/certification barriers (qualification cycles start at 2-3 years);
- Long expansion cycles (building plus ramp-up takes 2+ years);
- Customers cannot route around it (no substitute exists).
✅ Takeaway: bottleneck = highest margin = strongest bargaining power
The bottleneck is the highest-margin, most powerful segment. Every chain has a link others wait on — find the bottleneck first, then see which companies occupy it. That is step one, more important than looking at market caps.
Method 2: Track price transmission
- PPI and the cost-transmission chain: upstream input prices rise → midstream costs climb → midstream raises its prices → downstream end prices rise. Tracking the "spread" (product price − input cost) beats tracking single prices.
- Watch how smoothly transmission flows: stable midstream gross margins = smooth pass-through; compressed margins = blocked transmission, hurting midstream profits.
- Transmission lags: upstream hikes typically reach downstream pricing 1-3 quarters later — the "profit vacuum" during transmission is precisely the forecasting opportunity in industry chain research.
Method 3: Reverse-engineer the landscape from related-party transactions
- Check leaders' purchasing/sales counterparties: concentration of top customers and suppliers reveals concentration and bargaining relations up and down the chain.
- Check related-party transactions and receivables: segments with ballooning receivables are usually the ones whose customers occupy their funds (weak bargaining power).
- Watch cross-shareholdings and strategic alliances among heads: chain alliances hint at technology routes and lock-in structures.
Method 4: Draw the industry chain map (template)
Upstream materials/components ──▶ Midstream manufacturing/integration ──▶ Downstream brands/end products ──▶ End demand
   ▲                    ▲                    ▲
Supply concentration   Capacity utilization   Channel inventory
Price & inventory      Spread & gross margin   Sales & penetration
Annotate each segment: representative companies, concentration, current prosperity, profit trend. One map plus four rows of notes is an updatable working draft of the chain.
7. Hands-on Exercise: The AI Compute Industry Chain
Walk through the full method from Sections 1-6 (illustrative/fictional data):
Step 1: Draw the map
| Layer | Segment | Representative Participants | Concentration | Bargaining Power |
|---|---|---|---|---|
| Upstream | AI chips (GPU/ASIC), HBM memory, advanced-node foundry services | Leading chip designers, memory makers, wafer fabs | Very high (oligopoly) | Very strong |
| Upstream | Optical modules, servers, liquid cooling, power equipment | Leading telecom/server vendors | Medium | Medium |
| Midstream | IDC/AI data center construction & operations | Telecom operators, third-party IDCs, cloud providers | Fragmented | Weak-to-mid |
| Downstream | LLM training, inference applications, agents | Cloud providers, AI application companies | Fragmented | Weak (unsettled) |
Step 2: Find the bottleneck
- Bottleneck 1: advanced AI chips and HBM memory — supply far below demand, long expansion cycles, strongest bargaining power.
- Bottleneck 2: advanced-node capacity — only a handful of foundries worldwide can produce it; a physical bottleneck.
- Conclusion: the fattest, most certain profits sit in chips/memory/advanced nodes, not in the application layer.
Step 3: Judge transmission and prosperity
- Cloud providers' capex is the key leading indicator: raised capex guidance → optical module/server orders → data center construction → power and cooling infrastructure, transmitting down the chain stage by stage.
- Assumed current position: compute demand is still exploding, but watch for capex peaking signals — once big-tech capex guidance turns, shovel sellers' order growth slows first.
Step 4: Reach an actionable conclusion (example)
- Main thesis ranking: bottleneck segments (chips/memory) > elastic segments (optical modules/liquid cooling) > lagging segments (power infrastructure).
- Risk list: technology-route switches (in-house ASIC displacing GPU), concentrated capacity releases, capex cycle peaking.
- Update cadence: track big-tech capex guidance, GPU delivery lead times, and memory spot prices monthly.
💡 Exercise requirement: draw a complete industry chain yourself
Requirement: apply the same four-step method to another chain of your choice (humanoid robots, innovative drugs, low-altitude economy). If you can't draw the map, you haven't gathered enough material; if you can draw it but can't explain where the money flows, your analysis isn't there yet.
⚠️ Risk Warning
⚠️ Risk Warning
Industry chain analysis delivers a "structural verdict," but structure gets broken dynamically — technology-route switches (e.g., in-house chips replacing purchased ones), geopolitics and export controls, and capacity-release timing can instantly redistribute profit. The fattest bottleneck segments also tend to carry the richest valuations: picking the right segment but buying at the top still loses money. And "selling shovels" is not "guaranteed profit" — shovels suffer overcapacity too. This is educational methodology content, not investment advice; every chain conclusion must be dynamically verified against high-frequency data such as prices and orders.