The concepts chapter already covered: forex as the world's largest market, how to read quotes, how to compute pip value, and how dangerous leverage is. This chapter goes hands-on: every major pair has its own "personality" — some steady, some explosive, some tracking commodities; then it works through lot size, pip value, and P&L with complete numeric examples; then the activity patterns of three sessions, forex-specific uses of technicals and fundamentals — ending in an executable beginner workflow.
1. The "Personalities" of Major Pairs
The classic beginner mistake: treating forex as one uniform instrument with one method for all pairs. In reality each pair is a combination of two economies, with vastly different volatility profiles. Picking the pair whose personality matches you matters more than picking direction.
USD Majors
| Pair | Nickname | Personality | Key Logic |
|---|---|---|---|
| EUR/USD | Fiber | Steadiest, most standard | World's deepest liquidity, tightest spread (~0.1–0.5 pips at mainstream brokers), textbook volatility rhythm — the only pair recommended for beginners |
| USD/JPY | Gopher | Tracks Japanese bond yields | Watch US–Japan rate spreads; BOJ policy (YCC/hikes) is the biggest source of surprise events |
| GBP/USD | Cable | More volatile, hot-tempered | Slightly wider spread, many intraday false breakouts; BoE speeches and Brexit-type politics often trigger impulses |
| AUD/USD | Aussie | Commodity-linked, rate-sensitive | Watch iron ore/copper and Chinese demand; RBA decisions bring sharp moves |
| USD/CAD | Loonie | Oil market bellwether | Highly correlated with WTI/Brent crude; CAD strengthens when oil rallies |
| NZD/USD | Kiwi | Mild commodity currency | Watches dairy prices and AUD's mood; usually less volatile than AUD |
| USD/CHF | Swissy | Safe-haven currency | The franc is a traditional haven; CHF tends to strengthen on geopolitical risk / equity crashes |
The Numeric Logic of Commodity Currencies
AUD / NZD / CAD are called commodity currencies because their economies depend heavily on resource exports, creating observable linkages between exchange rates and commodity prices. The point isn't "guessing direction from headlines" but knowing which layer of numbers drives what:
- Australian dollar (AUD): watch iron ore and copper. Australia is the world's top iron ore exporter, so ore prices anchor AUD/USD; copper (a proxy for Chinese demand) strength also lifts AUD.
- Rough chain: China is the biggest iron ore buyer → China manufacturing momentum (PMI, property starts) → ore demand → ore price → AUD direction.
- Canadian dollar (CAD): watch crude oil. Canada is a major producer, and oil is its largest export.
- Rough chain: each leg up in WTI raises export revenue → CAD strengthens → USD/CAD falls (mind the quoting direction: stronger CAD = smaller USD/CAD number).
- New Zealand dollar (NZD): watch dairy. NZD often moves with AUD (linked economies) but usually swings less.
Data note: these "linkages" are long-run statistical correlations, not causal laws — they can decouple short-term (e.g., in 2022 CAD still weakened despite high oil because the dollar was too strong). Specific correlation ranges defer to the latest data.
Cross Pairs
Pairs without USD are called cross pairs, e.g., EUR/JPY, GBP/JPY, AUD/NZD, EUR/GBP:
- Cross pairs are typically more volatile than majors (two legs stacked), and GBP/JPY is famous for violent swings — a retail blow-up epicenter;
- A cross pair expresses "the relative strength of two countries" and suits experienced traders with clear views; beginners should start with EUR/USD;
- Cross spreads are wider than majors', raising short-term trading costs.
One-Line Summary
| Trader Type | Recommended Pairs | Why |
|---|---|---|
| Beginner | EUR/USD | Tightest spread, tidiest trends, most information |
| Trading commodities | AUD/USD, USD/CAD | Clear linkage to iron ore/copper/oil |
| Hedging risk | USD/CHF, USD/JPY | Driven by geopolitics and risk sentiment |
| Chasing volatility | GBP/USD, GBP/JPY | Big moves — and fast losses |
2. Pip Value and P&L (Complete Numeric Derivation)
Pip value math is forex's "multiplication table". The concepts chapter gave the formula; here we do the full derivation: from dollars-per-pip per standard lot to complete P&L under lot size, price, and leverage.
Basic Definitions
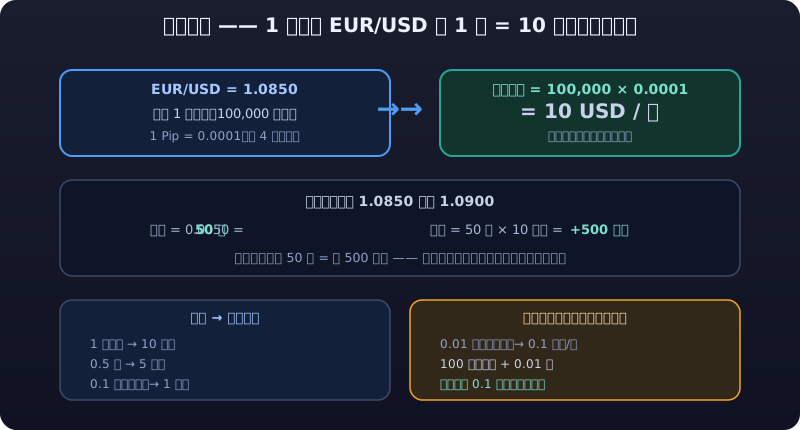
- 1 standard lot = 100,000 units of the base currency (1 lot EUR/USD = €100,000; 1 lot USD/JPY = $100,000)
- 1 pip: most pairs = 4th decimal place (0.0001); JPY pairs like USD/JPY = 2nd decimal place (0.01)
- Value of 1 pip on EUR/USD = 100,000 × 0.0001 = $10 — the most familiar number in forex; memorize it
Derivation 1: Price Change → Pips → P&L (EUR/USD)
Buy 1 standard lot at EUR/USD = 1.0850:
| Step | Calculation | Result |
|---|---|---|
| Price rises to 1.0900 | Up 0.0050 | = 50 pips |
| Value per pip | 100,000 × 0.0001 | $10 |
| Profit | 50 pips × $10 | $500 |
Symmetrically: down 50 pips = a $500 loss.
Derivation 2: Lot Size vs Per-Pip Value
| Lot Size | Notional Value | Value per Pip (EUR/USD) |
|---|---|---|
| 1 standard lot | 100,000 | $10 |
| 0.5 lots | 50,000 | $5 |
| 0.1 lots (mini) | 10,000 | $1 |
| 0.01 lots (micro) | 1,000 | $0.10 |
Why mini/micro lots matter: the only correct way for beginners to practice with small capital. $100 account + 0.01 lots = only $0.10 per pip — tuition stays affordable.
📖 Click to expand: Derivations 3–4 (USD/JPY's special pip value + full P&L with leverage)
Derivation 3: USD/JPY's Special Pip Value
USD/JPY = 150.00, 1 standard lot:
- 1 pip = 0.01; P&L accrues in yen: 100,000 × 0.01 = ¥1,000
- Converted back: 1,000 ÷ 150.00 ≈ $6.67/pip
Note: USD/JPY's per-pip value changes with the rate — the more the yen depreciates (bigger number), the less each pip is worth in dollars. For pairs like EUR/USD (USD as quote currency), the per-pip value is fixed at $10/standard lot regardless of price.
Derivation 4: Full P&L with Leverage
Account $1,000, leverage 1:100, 0.1 lots (mini) EUR/USD:
| Item | Calculation | Value |
|---|---|---|
| Notional value | 0.1 lots × 100,000 | $10,000 |
| Used margin | 10,000 ÷ 100 | $100 |
| P&L per pip | 0.1 lots × $10 | $1/pip |
| Market moves 80 pips | 80 × $1 | +$80 / -$80 |
| Market moves 300 pips | 300 × $1 | +$300 / -$300 |
Key insight: leverage doesn't change P&L itself (how much 0.1 lots gains or loses is leverage-independent); leverage determines how much money you have available to survive the swing. With $100 margin used from a $1,000 account, a 1,000-pip move against you zeroes you out — and triple-digit daily ranges in EUR/USD are normal.
💀 Iron Rule: Fully Leveraged at 1:100, Your Blow-Up Distance Is Measured in Hours
Trading full size at 1:100 leverage puts your blow-up distance on a scale of hours. A $1,000 account holding 1 lot of EUR/USD blows up 100 pips against you; triple-digit daily moves in EUR/USD are normal. So the core question of margin trading isn't "how to profit" but "how not to blow up" — use mini/micro lots, low leverage, wide stops, and stretch your blow-up distance past an entire overnight hold.
Derivation 5: Blow-Up Distance (The Math)
| Account | Lots | Per Pip | Margin (1:100) | Adverse Pips to Blow-Up |
|---|---|---|---|---|
| $1,000 | 1 lot | $10 | $1,000 | ~100 pips |
| $1,000 | 0.1 lots | $1 | $100 | ~1,000 pips |
| $5,000 | 0.5 lots | $5 | $500 | ~900 pips |
Simplified teaching figures (excludes spread, slippage, and floating P&L effects on margin). But the conclusion stands: fully leveraged at 1:100, your blow-up distance is measured in hours.
3. Sessions and Volatility Patterns
Forex trades 24 hours Monday–Friday, but each session has completely different "lead actors". Beijing-time view (DST basis; add 1 hour in winter):
| Session | Beijing Time | Lead Pairs | Traits |
|---|---|---|---|
| Asian session | ~08:00–15:30 (Tokyo-led) | AUD/JPY, NZD/USD, USD/JPY, AUD/USD | AUD/NZD/JPY most active; generally quiet, wider spreads, few trends |
| European session (London) | ~15:30–00:30 | EUR/USD, GBP/USD, EUR/JPY | Largest global session, EUR/USD most active, volatility builds from 15:30 |
| US session (New York) | ~20:00–05:00 next day | USD/JPY, USD/CAD, USD/CHF | US data (NFP/CPI) lands here; the London-overlap 20:00–00:30 window is the day's most volatile |
| Overlap window | ~20:00–00:30 | All pairs | Best liquidity, tightest spreads, but biggest moves |
Three session disciplines for beginners:
- Trade EUR/USD during London hours (after 15:30) — that's when it has any "personality"; touching it in Asia is rowing a boat in freshwater and paying tax for it.
- Crosses like AUD/JPY are active only in Asia — if you want Asian-session action, pick AUD/JPY crosses; don't wait for euro moves in Tokyo hours.
- At 8:30 ET (20:30/21:30 Beijing), NFP/CPI releases jolt every pair — beginners should simply be flat and enter only after the move plays out.
Timing note: DST basis (Mar–Oct) Beijing time; winter shifts everything 1 hour later; each broker's close/rollover times defer to platform announcements.
✅ Conclusion: Trade EUR/USD in London Hours, Not Asia
Trade EUR/USD in the London session (after 15:30) — that's the only time it has "personality"; touching it in Asia is rowing in freshwater while paying tax. So lesson one of forex is "pick the session": different pairs trend in different sessions, and choosing wrong means donating to spreads and fake moves.
4. Applying Technical Analysis to Forex
Candlesticks, moving averages, and trendlines work the same as in stocks, but several forex-specific technical rules are essential:
1. 24-Hour Continuity vs Daily Close
- Forex trades around the clock with no natural gap-based separation (markets close only on weekends).
- Brokers' daily candles typically close at 5:00 PM ET (5:00 AM next day Beijing time, DST) — one daily bar runs from 17:00 ET to 17:00 ET the next day.
- Implication: where and how the daily candle closes matters far more than intraday extremes; for daily-level analysis use bars divided by broker close time, never midnight cuts (which misread an "intraday breakout" as a "daily breakout").
2. Support/Resistance Meaning: Round Numbers as Psychological Levels
Forex has a unique "big figure" phenomenon: prices repeatedly stall or find support near round-number levels (e.g., EUR/USD's 1.1000, 1.2000; USD/JPY's 150.00, 155.00). Why:
- Institutional orders and option barrier levels cluster at round numbers;
- Retail traders treat round prices as "reasonable targets", concentrating buying and selling there;
- Breakouts through big figures often accelerate on volume — and false breakouts abound, with stop-entry clusters frequently swept.
Practical use: treat big figures like 1.1000 as default support/resistance references, combined with order-flow logic — when price approaches a round number, reduce size or wait for confirmation rather than gambling on one breakout.
3. Strong Trends, Long Consolidations
- Forex trends at higher timeframes (daily/4H) more persistently than most stocks — rates are driven by macro rate differentials, so once established, directions can run for months (like the Fed's 2022–2024 hiking cycle);
- But below 15 minutes, false breakouts multiply and ultra-short trading becomes a meat grinder of spreads and slippage;
- Conclusion: forex rewards "trend-following at higher timeframes", not beginner-style 5-minute churn.
4. Fundamentals Lead, Technicals Follow
Forex is the most directly fundamental-driven market: technical setups can invalidate instantly at data releases. The correct usage: "trend-follow outside data windows; stay flat around them".
5. Fundamental Trading: Central Banks, Data, and Rate Expectations
Central Bank Policy: The Most Important Fundamental
| Central Bank | Decision Cadence | What to Watch |
|---|---|---|
| Federal Reserve (FOMC) | 8/year | Rate decision + dot plot + Powell presser |
| ECB | ~8/year | Rate decision + Lagarde remarks |
| BOJ | 8/year | Rate decision + bond purchases (yield targets during YCC era) |
You trade the surprise: a hike that markets already priced isn't bullish — only the part exceeding or missing expectations moves the market. Volatility spikes around decisions, and direction flips fast.
⚠️ Counterintuitive: You Trade the Surprise, Not the Data Itself
You trade the surprise: an already-priced hike isn't bullish — the beat or miss versus expectations is the trade. So the core skill of FX fundamentals isn't "predicting data" but "knowing the consensus forecast beforehand" — from the economic calendar's forecast column; checking forecasts before events is step one. Good or bad data matters less than the deviation from expectations.
NFP and CPI: The Biggest Move-Makers
- Nonfarm payrolls (NFP): first Friday monthly at 8:30 ET. Strong jobs → hike expectations rise → dollar strengthens. EUR/USD can jump 50+ pips within seconds of release.
- CPI: mid-month. Hotter inflation → hike expectations rise → dollar up; softer → dollar down.
- PCE: the Fed's preferred inflation gauge, rising in importance recently.
Rate Expectations: Buy Strength in Hiking Cycles
A currency's medium-term direction = the gap between two countries' rate expectations:
- A country entering a hiking cycle → its currency tends to strengthen (capital chases yield);
- A country entering a cutting cycle → its currency tends to weaken.
Classic example: the Fed's aggressive hikes in 2022–2023 drove the dollar index from 95 to 114; as cut expectations built in 2024, the dollar retreated. Watching central banks' "direction + pace" beats fixating on single data points.
Data note: historical prices are teaching references; latest rates and decision schedules defer to official announcements.
The US Dollar Index DXY: The Ruler of Global Assets
The US Dollar Index (ticker DXY) measures the dollar's overall strength against a basket of major currencies, compiled and published by ICE (Intercontinental Exchange). Global commodities are priced in dollars, so a rising DXY tends to pressure gold/oil/non-US assets; it is the "steering wheel" for cross-border investors and macro traders.
| Currency | Weight (historical reference) |
|---|---|
| Euro EUR | ~57.6% |
| Japanese yen JPY | ~13.6% |
| British pound GBP | ~11.9% |
| Canadian dollar CAD | ~9.1% |
| Swedish krona SEK | ~4.2% |
| Swiss franc CHF | ~3.6% |
The basket weights were set after the 1973 collapse of the Bretton Woods system and are updated rarely; the renminbi is not yet in the DXY basket (other baskets such as the CNH index exist). Defer to ICE's latest methodology for exact weights. How to read it: DXY up = dollar stronger, usually corresponding to weaker non-US currencies (EUR/USD down, USD/JPY up); and vice versa.
Dollar Strength: The Linkage with Gold/Oil/Crypto
The dollar is the "anchor currency" of global asset pricing, and its strength transmits directly to other assets:
| Asset | Linkage logic | Common pattern |
|---|---|---|
| Gold | Priced in dollars + gold as the dollar's "substitute" | Strong dollar → gold pressured; weak dollar → gold stronger (negative correlation, not absolute) |
| Crude oil | Priced in dollars; a stronger dollar raises other countries' purchase cost | Strong dollar → oil tends to be pressured (still dominated by supply-demand) |
| EM stocks and bonds | Strong dollar → EM dollar-debt stress, capital flows back to the US | A strong dollar often suppresses emerging-market assets |
| Crypto (BTC etc.) | Some funds treat it as "digital gold" with high volatility | Crypto often benefits when dollar liquidity is loose (the Fed cutting); pressured when liquidity is tight |
These are statistical correlations, not causal laws — in 2020-2021 the dollar and BTC even rose together. In practice, treat the dollar index as "background music", not "the only signal".
Risk Sentiment and Geopolitics
- Risk sentiment switches: when the regime flips between "risk-off" and "risk-on", money rushes into the dollar, yen, franc, and gold (safe assets) and out of the AUD, NZD, and emerging-market currencies (risk assets). When geopolitical conflict escalates (war, sanctions), the dollar and gold rising together is a familiar picture.
- Geopolitics and politics: trade wars, sanctions, elections, and energy crises can all reset a currency's long-term valuation anchor. Examples: the ruble's violent depreciation during sanctions on Russia; sterling's long pressure during Brexit.
6. A Beginner Workflow for Forex
Everything above compressed into one executable beginner workflow:
① Pick one pair: trade only EUR/USD (tightest spread, most information, tidiest behavior)
   ↓
② Check the session: act only in the London/NY overlap (~20:00–00:30) or early London
   ↓
③ Set direction: read the daily first (rate expectations + MA/trendline); within the daily bias, find entries on 1H/4H
   ↓
④ Small size: start at 0.01–0.1 lots; account must survive at least 500 adverse pips
   ↓
⑤ Stop discipline: stop before entry, always; ≤2% risk per trade; flat before data windows
Each rule maps to a common death:
| Workflow Step | Consequence of Skipping It |
|---|---|
| Ignoring EUR/USD, randomly trading GBP/JPY | Volatility beyond tolerance; stops become meaningless |
| Ignoring sessions, heavy EUR/USD in Asia | Wide spreads, no trend — pure donation |
| No daily bias, chasing every rise | Fighting the higher timeframe, swept repeatedly |
| Position too heavy | Blown up in 100 pips (see Derivation 5) |
| No stops / holding through data | NFP's instant 50-pip slippage punches straight through |
Risk Warning
⚠️ Risk Warning
FX margin trading carries extreme leverage risk: above 1:100, an ordinary 1% market move produces a 100% equity swing; blow-ups can occur within hours, and extreme markets can even produce negative balances. Consistently profitable retail FX traders are vanishingly rare; unregulated platforms carry fraud risks like manipulated quotes and blocked withdrawals. All figures here (pip values, P&L, margin, volatility magnitudes) are teaching references — defer to the latest market data, broker terms, and regulations. This article is not investment advice.